Sunday, November 29, 2020

What B2B Buyers Rely On to Make Purchase Decisions


Earlier this month, TrustRadius published the findings of its fifth annual B2B buying disconnect research. The 2021 B2B Buying Disconnect report is based on two surveys that were conducted in September of this year.

One was a survey of 907 individuals who are involved in making business technology purchases for their organization, and the second was a survey of 227 individuals who work for technology vendors in a sales or marketing capacity. More than 75% of the respondents in these surveys were based in the United States.

In my last post, I described some of the characteristics of the technology buying process identified by the TrustRadius research. In this post, I'll discuss what the TrustRadius study discovered about how technology buyers learn about products or services and research potential purchases. I'll also review where there are still disconnects between technology buyers and sellers.

It's important to note that the TrustRadius research focused exclusively on the attributes of technology sales and purchases and on the attitudes and behaviors of technology buyers and vendors. Therefore, the results of the TrustRadius surveys may not be completely applicable to all types of B2B purchases and sales. However, these research findings are relevant for those that involve high-consideration products or services.

Information Used to Inform Buying Decisions

A primary focus of the TrustRadius surveys has been to identify what sources of information technology buyers use to inform and support purchase decisions and which sources they view as trustworthy and influential. The latest survey found that buyers used an average of 6.9 sources of information when researching potential purchases, up from 5.1 sources in last year's survey.

The sources of information most widely used by technology buyers have not changed for the past five years, although their rank order has varied slightly. In the latest TrustRadius buyer survey, the five most frequently used sources of information were:

  1. Product demos (58% of buyer respondents)
  2. Vendor/product websites (51%)
  3. User reviews (45%)
  4. Vendor representatives (43%)
  5. Free trials/accounts (41%)
The Disconnect - In the seller survey, TrustRadius asked technology vendors what marketing tactics they used to engage buyers in 2020. The following table compares the percentage of sellers using each marketing tactic (the top 5 identified by seller respondents) with the percentage of buyer respondents who reported using that source of information. As the table shows, buyers and sellers generally agree about the importance of product demos and vendor/product websites, but sellers overvalue the importance of marketing collateral, case studies, and customer references.


Information Trust and Influence
TrustRadius also asked technology buyers about the trustworthiness and influence of the information sources they use to support purchase decisions. Three of the five most widely used sources of information - free trials/accounts, product demos, and user reviews - also received high marks from buyers for trustworthiness and influence. This suggests that buyers favor sources of information that provide direct hands-on experience with a product and those that feature the opinions of actual users of a product or service.
The Disconnect - Only one of the three most trusted and influential sources of information - product demos - is among the top five marketing tactics used by vendors. In addition, three of the marketing tactics most widely used by vendors - marketing collateral, case studies, and customer references - were not rated highly by buyers for trustworthiness or influence.
How Buyers First Learn About Products
The top three ways that technology buyers first learn about new products are:
  1. Their own prior experience with the product (25% of buyer survey respondents)
  2. Recommendations from their network (15%)
  3. Online search for top products (15%)
On this issue, there isn't much of a disconnect between buyers and sellers. In the TrustRadius seller survey, the respondents identified the same three top ways that buyers first learn about products. 
One noteworthy difference between buyers and sellers relates to industry events. Nearly half of the surveyed sellers (49%) believe that buyers first learn about products at conferences and tradeshows, but only 10% of surveyed buyers said they first learn about products at such events.
The buyers' response on this point may have been influenced by the absence of in-person events this year, but it also may be that sellers tend to overestimate how often buyers first learn about products at conferences and tradeshows.

Top image courtesy of Jinx! via Flickr CC.

Sunday, November 22, 2020

New Research Unveils the Attributes of B2B Technology Buying and Selling


Image Source:  TrustRadius

This month, TrustRadius published the findings of its fifth annual B2B buying disconnect study. The 2021 B2B Buying Disconnect report provides a wealth of valuable insights regarding the sale and purchase of business technology solutions.

The report is based on two surveys that were fielded in September of this year. One was a survey of 907 individuals who were involved in making business technology purchases for their organization, and the second was a survey of 227 individuals who work for technology vendors in a sales or marketing capacity. More than 75% of the respondents in both surveys were based in the United States.

These surveys addressed a broad range of topics. The buyer survey includes findings about the technology buying process, how technology buyers learn about products and services and research potential purchases, and how they view technology vendors. The seller survey explored how technology vendors seek to engage potential buyers and how they rate the effectiveness of their marketing and sales tactics. And of course, both surveys addressed how the COVID-19 pandemic has impacted technology buying and selling in 2020.

The TrustRadius study focused exclusively on the attributes of technology sales and purchases and on the attitudes and behaviors of technology buyers and vendors. While the results of these surveys may not be completely applicable to all types of B2B purchases and sales, it's likely they would be similar to those involving complex, high-consideration products or services.

It will take a few posts to unpack the results of the TrustRadius research. In this post, I'll describe some of the basic attributes of technology buying and selling in 2020 and what we may see in 2021.

Technology Spending in 2020 and 2021

In the TrustRadius buyer survey, 49% of the respondents said their spending on technology products and services decreased in 2020, 27% reported increased spending, and 19% said their spending had not changed. It's noteworthy that only 21% of the buyer respondents expected their 2020 technology spending to decrease "substantially."

These responses reflect the uneven economic impacts of the pandemic. COVID-19 has severely affected companies in some industries (travel and hospitality, for example), while several other types of businesses have experienced dramatic revenue growth (think Amazon and Zoom).

TrustRadius found that the outlook for technology spending in 2021 is mixed. Fifty-six percent of the respondents in the buyer survey expect their technology spending to return to pre-pandemic levels or increase in 2021, while 17% expect spending to decrease next year, and 27% aren't sure what their technology spending will look like in 2021. More specifically, a majority of the buyer respondents expect to spend more on video and web conferencing software (64%) and online collaboration/project management software (53%) in 2021.

More Time Spent on Buying

TrustRadius also found that the pandemic has changed how much time buyer spend on technology purchases. In the buyer survey, about one-third of the respondents said they spent more time this year:

  • Clearly defining the expected ROI of technology investments
  • Researching products
  • Comparing products
  • Prioritizing selection criteria
Interestingly, 26% of the buyer respondents said they spent less time in 2020 talking with vendor representatives, and 20% reported spending less time consulting with their buying committee.
Despite buyers' efforts to streamline the buying process, vendors believe the COVID-19 pandemic has resulted in longer sales cycles. In the seller survey, 57% of the respondents said their deal cycles are longer than before the pandemic. One in four respondents said the length of their sales cycle hasn't changed, and 19% reported shorter sales cycles.
Buying Groups Get Slightly Smaller
During 2020, a significant number of employees at B2B companies have been working from home. Online conferencing tools such as Zoom and Microsoft Teams have enabled remote employees to perform their work fairly effectively. However, the pandemic appears to have caused some companies to reduce the number of people involved in purchase decisions.
In the latest TrustRadius buyer survey, respondents indicated that 67% of buying decisions are made by buying groups composed of 2 to 5 individuals. That was up from 61% of buying decisions in last year's survey. Meanwhile, the percentage of buying decisions made by buying groups composed of 6 or more people fell from 34% in last year's survey to 29% in this year's survey.
Coming Up
In my next post, I'll discuss what the TrustRadius research says about how technology buyers learn about and research products and services.

Sunday, November 15, 2020

More Evidence on How B2B Marketers Have Responded to COVID-19


Image Source:  Allocadia

Over the past six months, I've devoted several posts to reviewing research studies that have examined the impact of COVID-19 on B2B marketing and buying behaviors.

  • The first series of posts (available here, here, and here) discussed the findings of a special edition of The CMO Survey that was fielded in May.
  • In July, I published a post (Research Highlights How COVID-19 Has Changed B2B Buyer Behaviors) that described the results of an April survey conducted by Wunderman Thompson Commerce. The research focused primarily on the expanding role of e-commerce in B2B buying.
  • Most recently, I published a post (Mid-Summer Research Updates COVID's Impact on B2B Marketing) discussing a June survey by Edelman and LinkedIn. This survey asked B2B marketers about how buying behaviors had changed and what actions they need to take to respond to those changes.
COVID-19 has obviously been the issue of 2020, and these three surveys have provided important insights about how both marketers and buyers have responded to the pandemic. A recent report by Allocadia provides more valuable insights on this topic from a somewhat different perspective.
Allocadia provides marketing management and budgeting software, and the 2020 State of Spend report is based on aggregate data from Allocadia's customer base. The data was pulled in June. Allocadia's report is particularly useful because in describes actual spending decisions made by companies dealing with real-world circumstances.
Key Findings from Allocadia's Analysis
Marketing Spending - More than half (56%) of Allocadia's customers saw their marketing program spending reduced by more than 10% in the first half of 2020. Fifteen percent of the companies lost more than one-third of their marketing program budgets in that period.
Events - Spending on events fell by 46% in the second quarter of this year. However, Allocadia's customers were forecasting a 24% increase in spending on events in the third quarter. Allocadia believes that much of the forecasted increase is attributable to spending on virtual events, and I tend to agree with this hypothesis.
Digital Advertising - Overall spending on digital advertising increased by 2% in the second quarter, but spending varied significantly based on company size. The smaller companies in the study (those having less than $250 million in revenue) increased digital advertising spending by 9.3% in the second quarter, while the largest companies in the analysis (those having more than $5 billion in revenue) cut spending on digital advertising by 30.7% in that quarter. Companies of all sizes were forecasting higher levels of digital ad spending in the third quarter, with the over $5 billion companies projecting an increase of 183.6%.
Brand vs. Demand Spending - According to decades of research studies, companies that continue to market aggressively during a recession will recover faster and probably gain market share when the recession ends. This is particularly true when the marketing focuses on building brand awareness and brand preference. Most of Allocadia's customer did not follow this strategy.
Spending on brand marketing fell by 16% in the second quarter, and 45% of the companies in this study cut public relations budgets by more than 20% in that quarter. These companies did forecast a 17% increase in brand identity spending in the third quarter, which suggests that the cuts in brand marketing may only be temporary.
Meanwhile, spending on direct marketing increased by 23% in the second quarter, but was forecast to decrease by 1% in the third quarter. If this forecast was accurate, it means that direct marketing spending in the third quarter was 22% higher that in the first quarter of this year.
 Content Marketing - Overall spending on content marketing grew by 12% in the second quarter of this year, and nearly four in ten companies (39%) increased spending by more than 20%. Allocadia's customers were also forecasting an additional 8% increase in the third quarter. Allocadia believes that the second quarter increase in content marketing spending resulted from the increased use of direct marketing in that quarter.
My Take
The spending decisions made by Allocadia's customers are not surprising given the economic shock created by the pandemic. The more to reduce spending on brand marketing and increase investments in direct marketing is particularly understandable.
When faced with a sudden economic downturn that threatens revenues, marketing leaders have a strong tendency to favor those activities that seem most likely to produce a short-term impact on sales. The irony is, many marketers shift resources to short-term "performance" marketing programs exactly when the prevailing business and economic conditions are likely to make those short-term tactics largely ineffective.
Mark Ritson, the noted marketing expert and a regular columnist for MarketingWeek, stated his view of a better approach when he wrote:
"Confronted with a 50% cut in marketing budgets, the smarter play is to actually focus more of it on the longer-term brand-building mission. Performance marketing is going to under-perform in the current market conditions. But this virus, too, shall pass. At some point consumers will return to the streets, the cafes and the various other activities that they have been denied during the dark days ahead. Keep the brand light burning, because the cost of snuffing it out for the rest of 2020 and then trying to reignite it next year is gigantic."

Sunday, November 8, 2020

Research Maps Spending on Content Marketing


Image Source:  The Branded Content Project/Borrell Associates Inc.

Companies in the United States will spend $63.3 billion on content marketing this year, according to new research commissioned by The Branded Content Project. In 16 business categories, the use of content marketing is nearly ubiquitous, and it accounts for between 45% and 66% of the total marketing budget.

In mid-2020, The Branded Content Project engaged Borrell Associates Inc. to measure and analyze the economic landscape of content marketing. Sizing the Content Marketing Opportunity is based on a multi-faceted analysis of the business of content marketing. Borrell used data from its periodic surveys of small and mid-size businesses, SEC filings of public companies, and a variety of other data sources.

Content Marketing Spending

Borrell's analysis found that U.S. companies spent $64.3 billion on content marketing in 2019. Because of COVID-19, Borrell projects that content marketing spending will decline by 1.5% to $63.3 billion in 2020. This slight decline is almost entirely attributable to major spending cuts by companies that have been hit hard by the pandemic.

For example, Borrell found that companies in travel/tourism, live entertainment, sporting events, clothing and recreation have reduced spending on content marketing in 2020 by an average of 19%. Meanwhile, several other types of businesses - including financial services firms and real estate agents - have actually increased spending on content marketing this year.

The Growing Importance of Content Marketing

This analysis also found that content marketing is becoming a more important part of marketing for many companies. In Borrell's October survey of SMB's, 45% of the respondents said that content marketing had become more of a priority in 2020, and 57% said they are planning to increase content marketing in 2021.

Digital Dominates Content Marketing

It should not be surprising that most content marketing is conducted via digital channels. The following table depicts the top five media channels used for content marketing in 2020. As the table shows, digital media accounts for about two-thirds (66.3%) of all spending on content marketing this year, and collectively, these five channels account for 92.3% of all content marketing spending.


Borrell argues that digital channels dominate content marketing for two main reasons. First, digital channels can accommodate a wide variety of content formats (text, video, audio, etc.), and many types of digital content can be interactive, which makes them more engaging to potential buyers. More importantly, many digital channels enable companies to publish large volumes of content without incurring incremental advertising costs.

Business Category Rankings

The Borrell report also provides detailed estimates for 100 distinct types of businesses. Borrell placed each type of business into one of six groups based on how likely that type of business is to engage in content marketing and what percentage of their marketing budget is devoted to content marketing. Borrell used the letters "A" through "F" to identify the six groups.

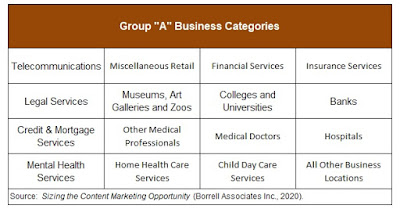
The 16 types of business organizations in group "A" (shown in the following table) are those that are most likely to be making extensive use of content marketing. In these businesses, the use of content marketing is nearly ubiquitous, and they spend between 45% and 66% of their marketing budgets on content marketing. These businesses are not necessarily the biggest spenders (on content marketing) in absolute terms, but they are devoting the highest percentage of their total marketing budgets to content marketing.


Organizations in group "B" aren't far behind. Borrell estimates that 75% to 85% of businesses in group "B" are using content marketing, and they are spending 40% to 60% of their marketing budgets on content marketing. Group "B" includes general merchandise stores (think Walmart, Target, etc.) and several types of media companies.

Two Caveats

It's important to make two points about the methodology used for this analysis. First, Borrell used an expansive definition of "content marketing." The report states:

"For this report, we considered Content Marketing to be the over-arching term that encompasses all facets of marketing - with content. This could be advertorials, native advertising, testimonials, many kinds of sponsorships, many kinds of branding, and any advertising that delivers some amount [sic] content besides a direct call to action."

This definition encompasses some marketing activities that many practitioners would not classify as "content marketing." So Borrell's spending estimates may be somewhat elevated.

On the other hand, Borrell's analysis did not include the internal costs that businesses incur to create and distribute content. Other research has shown that most companies are using internal resources to produce a significant about of marketing content. Therefore, Borrell's estimates probably understate the amount of spending actually devoted to content marketing.

Despite these caveats, Borrell's analysis makes an important contribution to our body of knowledge about content marketing.

Sunday, November 1, 2020

Gartner Research Maps the Landscape of Marketing Operations


 Image Source:  Gartner, Inc.

Gartner recently published the findings of the 2020 Gartner Marketing Operations and Organization Survey. The survey results are described in two reports - the 2020 Marketing Operations Survey report, and the Marketing Organization Survey 2020 report.

This year's survey was conducted in May and June, and produced 429 respondents in the United States, Canada, France, Germany and the United Kingdom. All respondents were required to be involved in decisions regarding marketing operations and/or the alignment of marketing budgets, resources and processes. The respondents came from a variety of industries, and 91% were with organizations having $1 billion or more in annual revenue.

Given the composition of this survey panel, the findings are most reflective of circumstances in large enterprises. However, many of the findings will also be useful for marketing leaders in mid-size companies.

Here's a  brief overview of some of the more interesting survey findings. Unless otherwise indicated, these findings are described in the 2020 Marketing Operations Survey report.

Adoption of Marketing Operations

Forty-nine percent of the survey respondents said that at least one marketing team in their organization has a dedicated marketing operations leader. Frankly, I was somewhat surprised by this finding. I would have expected this percentage to be higher, given the composition of the survey panel.

Other research has indicated that marketing operations functions have been implemented by many large and mid-size companies. In fact, Gartner's 2019 Marketing Organizational Survey found that more than two-thirds of marketing organizations have a discrete marketing operations function. And in Gartner's 2020-2021 CMO Spend Survey, marketing leaders ranked marketing operations as their third most vital marketing capability, behind only brand strategy and marketing analytics.

Current Scope of Marketing Operations

The 2020 survey also revealed that the responsibilities assigned to the marketing operations function vary significantly across companies. Gartner presented the survey participants with a list of 12 marketing activities and asked which of these activities was currently led or managed by their marketing operations function. The following table shows the percentage of respondents who selected each activity.


As this table shows, companies are using their marketing operations function to manage a wide variety of activities, and no activity was selected by a majority of survey respondents. This finding should not be surprising, given that marketing operations is still a relatively young business function.

Gartner hypothesizes that marketing leaders often create a marketing operations function to address whatever operational issues are most pressing at that time. Therefore, Gartner contends that the marketing operations role resembles that of a "chief of staff" whose primary job is to support the CMO.

Marketing Operations is Expanding

Gartner's research also indicates that marketing leaders plan to expand the scope of their marketing operations function in the near future. Gartner presented the survey participants a list of 12 marketing activities - plus a "none of the above" choice - and asked which of these activities would become part of their marketing operations mandate within the next 12 to 24 months. The five most frequently selected activities were:

  • Data sourcing, consolidation and management (29% of respondents)
  • Performance management, benchmarking and analytics (29%)
  • Strategic planning, alignment and oversight (28%)
  • Marketing technology management (27%)
  • Maintaining talent audits and capacity needs (26%)
My Take
In my view, marketing operations is destined to become a more important function in the marketing departments of most large and mid-size companies for two main reasons. First, marketing is increasingly dependent on a multitude of technology applications, so the selection, implementation, integration, and management of technology tools is increasingly critical. That is a classic role for marketing operations.
Second, many companies are moving significant portions of marketing work in-house. In Gartner's 2020-2021 CMO Spend Survey, the respondents reported that they had shifted an average of about one-third of the work previously done by external suppliers to in-house teams. For "in-housing" to be successful, companies will need to design and implement effective and efficient work processes, and that too is a classic job for marketing operations.