Sunday, August 21, 2022

[Research Round-Up] A Look at the Attitudes and Behaviors of B2B Technology Buyers

Image Source:  TrustRadius

In June, TrustRadius published the findings of its sixth annual survey of B2B technology buyers. The 2022 B2B Buying Disconnect report is based on a February 2022 survey of business professionals who were involved in the purchase of new software or hardware for their organization in the year preceding the survey. 

The survey received 2,185 responses from technology buyers. Seventy-five percent of the respondents were manager level or above, and just under two-thirds (63%) were affiliated with companies having 500 or fewer employees. Sixty percent of the respondents were millennials (ages 25-40), and 29% were GenXers (ages 41-56).

The primary message of this year's survey findings is that B2B technology buyers are more committed than ever to taking control of their buying process. For the press release announcing the publication of the survey report, Vinay Bhagat, the Founder and CEO of TrustRadius, said:

"The main theme echoed throughout our 2022 report is that we are in 'The Age of the Self-Serve Buyer.' In past years, we found that millennials and generation Zs were primarily relying on self-service channels. It's a fact that we've come to expect, but now, we're finding that all generations and decision-makers are following suit. Our research found that virtually 100% of buyers want to self-serve all or part of the buying journey, a 13% increase from just last year."

It's important to emphasize that the TrustRadius research focused exclusively on the attitudes and behaviors of B2B technology buyers. Therefore, the findings of the research may not be completely applicable to all types of B2B purchases. However, most of the findings are relevant for those that involve high-consideration products or services.

Information Used to Support Buying Decisions

A primary focus of the TrustRadius research has been to identify what sources of information B2B technology buyers use to support their purchase decisions. The researchers asked survey participants what resources they consulted during their evaluation process. The following table shows how respondents answered the question in the 2022 survey and in the 2021 edition of the survey. The table also shows the change in reported usage (percentage point difference) between 2022 and 2021.


As this table shows, except for product demos and vendor blogs, the use of vendor-provided sources of information by technology buyers declined from 2021 to 2022. In contrast, the use of most "independent" sources of information increased over the same period. This finding confirms that technology buyers are relying less on vendor-provided information when researching products and services.

TrustRadius also asked survey participants what information resources they considered most impactful when making purchase decisions. A majority of survey respondents identified five information resources as impactful.

  1. Product demos (71% of respondents)
  2. Free trial/account (67%)
  3. Their own prior experience (67%)
  4. User reviews (59%)
  5. Consultant recommendation (52%)
This finding clearly demonstrates the importance that B2B technology buyers place on having or gaining first-hand experience with a product before they make a purchase decision.
What Buyers Want To Do On Their Own
The latest survey also focused on the researching/buying activities that B2B technology buyers want to be able to perform on their own. The following table shows the percentage of surveyed buyers who indicated a preference for self-service for nine buying process activities.


This finding highlights the importance that technology buyers place on being able to find basic information (prices, technical specs, etc.) about products via a self-service channel. 
In fact, when TrustRadius asked survey participants what vendors can do to make them more likely to buy, the top suggestion (selected by 71% of respondents) was to make pricing information available on the vendor's website. Conversely, 16% of the surveyed buyers said they will stop considering a product if they can't easily find product information.
***
As noted earlier, the TrustRadius research focused exclusively on the attitudes and behaviors of B2B technology buyers. However virtually all types of B2B buyers are now relying more on independent sources of information when researching potential purchases, and they increasingly expect to perform many buying activities on their own. Astute B2B marketers will address both of these buyer expectations.

Sunday, August 14, 2022

[Book Review] "The Organic Growth Playbook" - A Proven Recipe for Driving Revenue Growth

Source:  Emerald Publishing Limited
Marketing leaders are under constant pressure to grow revenues. In fact, most marketing leaders now acknowledge that revenue growth is the raison d'etre of the marketing function. 

Marketing industry pundits have produced an abundance of resources addressing how marketing can drive business growth. However, most of these resources focus on how to use individual marketing techniques or tactics to generate growth. There are fewer resources that address growth from a more strategic perspective.

The Organic Growth Playbook:  Activate High-Yield Behaviors To Achieve Extraordinary Results - Every Time (American Marketing Association/Emerald Publishing Limited, 2020) by Bernard Jaworski and Robert Lurie provides a strategic methodology for consistently driving organic revenue growth.

The Thesis of the Book

The basic thesis of The Organic Growth Playbook is relatively simple. The authors contend that the conventional approach to marketing - which is primarily focused on differentiating a product or service in the minds of potential buyers - isn't a reliable way to drive revenue growth for most companies.

The logic of the conventional approach is that if a company positions its products or services well and effectively communicates that positioning to the right potential buyers, growth will follow. The authors disagree pointedly with the conventional wisdom. They write, ". . . great product positioning is a necessary condition for growth, but it's not sufficient in and of itself to drive growth."

Jaworski and Lurie argue that a more effective and reliable way to drive growth is to focus on shaping the activities that potential buyers perform as they move through the buying process. They contend that in every buying process, there are one or two activities that decisively shape what product or service the buyer ultimately purchases. They call these decisive activities high-yield behaviors.

High-yield behaviors often occur early in the buying process, which means that marketers often underestimate the impact they have on buying decisions.

One of the case studies in the book illustrates how important high-yield buying behaviors can be. This case study involved a company that manufactures commercial heating, ventilation and air conditioning equipment and energy management systems.

Historically, the company segmented its market by industry vertical and tailored its marketing messages and product bundles to these segments. In addition, the company's sales representatives focused primarily on responding to RFPs from larger prospects.

The company implemented the methodology described in The Organic Growth Playbook, and its analysis of the buying process for commercial HVAC equipment and energy management systems produced some interesting findings. It revealed that 52% of the potential customers that began a buying process ultimately made a purchase.

More importantly, the analysis revealed that just over 85% of the prospects that made a purchase chose a vendor they had consulted with during the early research phase of the buying process. So, prospects that ultimately made a purchase were 5X more likely to buy from a vendor they had engaged with early in their decision-making process than from a vendor that only became involved at the RFP stage.

These insights caused the company to redesign its marketing and sales efforts to focus on early engagement with potential customers, and as a result of these changes, the company's sales growth accelerated significantly in the three years after the changes were implemented.

The Playbook Process

The Organic Growth Playbook describes a five-step process for successfully driving organic revenue growth.

Map the Buying Process Waterfall - Identify all activities that potential buyers perform during the entire buying process, and determine how frequently each activity occurs. The idea is to quantify the flow of potential buyers through the process and to identify "drop off" and switch points where potential buyers exit the buying process or change buying paths. The ultimate goal of creating a waterfall map is to identify the one or two high-yield buying behaviors that have a disproportionate impact on the purchase decision.

Use Propensity-Based Segmentation - Segment potential buyers based on their propensity to engage in the high-yield buying behaviors revealed in the waterfall map. The idea is to identify the attributes that are shared by potential buyers who were most likely to engage in the high-yield behaviors and use those attributes as the basis of the market segmentation.

Identify the Drivers and Barriers of the High-Yield Behaviors - The objective of this step is to diagnose and articulate what most motivates potential buyers to perform the identified high-yield behaviors (the drivers) and what most deters them from engaging in those behaviors (the barriers)

Develop a Behavior Change Value Proposition - The fourth step in the Playbook process is to develop a value proposition that will entice potential buyers to engage in the target high-yield buying behaviors. A compelling behavior change value proposition will express the value to the potential customer of doing the high-yield behaviors compared to other possible buying behaviors, and thus increase their propensity to engage in the target behaviors.

Invest Disproportionately - The final step in the Playbook process is to make disproportionate investments in marketing programs that focus on the most attractive buyer segments and the most impactful high-yield buying behaviors. If the previous four steps of the Playbook process have been done well, such disproportionate investments will produce the best chances of achieving substantial revenue growth.

*****

The Organic Growth Playbook describes a proven methodology for driving revenue growth, but this methodology is not necessarily easy to implement. In addition, the process requires a relatively significant amount of original research, and the cost of that research won't be trivial in most cases. Nevertheless, marketers at large and midsize B2B companies should put The Organic Growth Playbook on their reading list and give serious consideration to the growth strategy it describes.

Sunday, August 7, 2022

Marketers Should Prepare for Sluggish Growth and Continued High Inflation


For the past few weeks, the hottest topic in the business/financial media has been whether the U.S. economy is headed into a recession. Every day, a parade of economists, market analysts and other pundits appear online, on TV and in print to give their view on the likelihood that a recession is on the horizon.

In addition, several major Wall Street investment firms have recently estimated that the odds of a recession occurring in the next several months have increased.

The odds of recession are increasing primarily because the U.S. Federal Reserve is tightening monetary policy in an effort to rein in historically high levels of inflation. Since the beginning of this year, the Federal Reserve Open Market Committee has raised the target federal funds interest rate 2.25%, and it has recently started reducing the size of the Federal Reserve's balance sheet (which tightens financial conditions).

The Committee has also indicated that additional interest rate increases are likely, and most Fed watchers are expecting an increase of 0.5% at the Fed's September meeting.

Marketers need to have a reasonably accurate picture of future economic conditions in order to develop sound marketing plans. As I've previously written, the health of the overall economy is one of the major factors that create the environment in which marketing plans will be executed. And while macro economic conditions affect different kinds of companies in different ways, they will impact the success of marketing efforts at most companies to some extent.

Unfortunately, the outlook for the U.S. economy over the next several months is far from clear. The uncertainty exists for several reasons, including the real-world impact of Federal Reserve's policy decisions, the continuing problems in global supply chains, and a possible energy crisis in parts of Europe this winter.

Given this high level of uncertainty, the best option for marketers is to focus on those future economic conditions that can be predicted with a reasonable degree of confidence. In my view, we can say two things about the direction of the U.S. economy over the next 6 to 12 months.

  1. Economic growth (as measured by real GDP) is likely to be slow even if we are able to avoid a recession.
  2. Inflation is likely to be persistent and remain above the Federal Reserve's target of about 2% per year, although there are some indications that we may already be past the peak of inflation.
Economic Growth
Real GDP growth slowed significantly in the first half of 2022. The following chart shows the trailing 12 month rate of real GDP growth measured at the end of the four most recent calendar quarters.


At the end of Q4 2021, the real GDP growth rate over the preceding 12 months was 5.5%. By the end of the second quarter of this year, the annual growth rate had fallen to 1.6%.
Most economists are predicting slow economic growth in 2022 and 2023. For example, the latest (July) forecast by The Conference Board is that real GDP will grow 1.7% in 2022 and 0.5% in 2023. (Note:  Many economists say the long-term sustainable growth rate of the U.S. economy is about 2% per year.)
Below-average growth over the next several months is the most likely scenario because it is difficult to envision any events that would trigger an increase in economic growth in the short run.
Inflation
Inflation has emerged as the most serious issue currently affecting the U.S. economy. The following chart shows the annualized rate of inflation for January through June of this year as reported monthly by the U.S. Bureau of Labor Statistics. The chart includes both the "headline" rate of inflation (All Items) and the "core" inflation rate (All Items Excluding Food & Energy).


The substantial and persistent gap between headline and core inflation shown in this chart demonstrates that high fuel and food prices have been major contributors to inflation this year. This, of course, won't be surprising to anyone who drives or eats.
On a positive note, there are some indications that inflation may already be easing. For example, as the above chart shows, the core inflation rate has been declining since March. In addition, AAA has reported that the national average price of gasoline fell from $4.85/gal on June 30th to $4.21/gal on August 1st. These declining gasoline prices should be reflected in the July consumer price index, which the Bureau of Labor Statistics will release on August 10th.
Even if inflation has already peaked, many economists and other analysts are forecasting that the rate of inflation will decline only slowly. In June, Federal Reserve Board members and Federal Reserve Bank presidents predicted that PCE inflation* in 2022 would be 5.2%, still substantially above the Federal Reserve's target inflation rate of 2%.
Key Takeaways
For marketers, the key takeaway here is that economic growth is likely to be sluggish for the next several months. The outlook for inflation is generally favorable, but energy market analysts have noted that most physical energy markets are still tight. Therefore, there is a substantial risk that energy prices could rise later this year and slow the progress on inflation.

*PCE inflation is the percentage rate of change in the price index for personal consumption expenditures. PCE inflation is generally considered to be the Federal Reserve's "preferred" measure of inflation.

Top image courtesy of CreditDebitPro.com via Flickr (CC).

Sunday, July 31, 2022

What Causes "No Decisions" - And What To Do About Them

At some time in our lives, most of us have experienced anxiety when we're faced with a major decision. In most cases, the level of our anxiousness is proportional to the potential ramifications of the decision we are facing. When the stakes are high enough, we can easily be tempted to avoid making a decision at all.

This phenomenon can affect both personal and business decisions. Many B2B companies track their sales performance by categorizing the outcomes of potential deals as wins, losses or no decisions. Typically, no decision is a catch-all category used for those potential deals that are neither successfully closed nor lost to a competitor.

Several research studies have shown that B2B companies lose more sales to no decisions than to competitors. For example, a recent large-scale study by Matthew Dixon and Ted McKenna found that between 40% and 60% of prospective sales result in no decision. In many cases, a potential customer will go through a thorough buying process, but ultimately fail to make a purchase.

Rational No Decisions

Some no decisions are entirely rational. For example, a prospect may decide not to make a purchase because their current solution is objectively superior (or at least nearly equivalent) to the proposed alternatives. In such cases, the proposed alternatives don't provide enough value to justify making a change. Or, a downturn in the financial condition of a prospective customer can result in the implementation of cost controls that effectively take the proposed purchase off the table.

The Status Quo Bias

Frequently, however, a prospect's decision not to make a purchase can't be explained on a rational basis. In such cases, psychologists and behavioral economists attribute the no decision to the status quo bias, a powerful cognitive bias that causes humans to prefer the status quo for non-rational reasons.

Psychologists demonstrated the existence of the status quo bias in the late 1980's. and since then, behavioral scientists have been attempting to identify the underlying cause or causes of the bias. The current thinking is that the status quo bias is probably caused by other biases in human decision making.

Daniel Kahneman has argued that the status quo bias is closely related to loss aversion. Loss aversion is the human tendency to prefer avoiding loses to acquiring equivalent gains.

Research by Kahneman and Amos Tversky in the 1970's showed that, for humans, the pain of a loss is psychologically twice as intense as the pleasure felt from an equivalent gain. Because of this effect, most people are risk averse, and they will tend to avoid making a decision that involves a risk of loss even when the decision could result in substantial gains.

Kahneman contends that most people make the status quo their reference point and tend to view change from the status quo as a loss, which makes them inclined to prefer the status quo.

Richard Thaler has argued that the status quo bias is closely related to a cognitive bias called the endowment effect. This bias refers to the fact that most people like and value something more simply because they already own it. The endowment effect can cause us to overvalue the benefits of the status quo and to under-appreciate its disadvantages.

Customer Indecision Also Drives No Decisions

While the status quo bias is an important cause of no decisions, recent research indicates that it isn't the only or most significant cause.

In an article published last month at the Harvard Business Review website, Matthew Dixon and Ted McKenna wrote that their research had shown that 56% of no decisions were caused by the inability of prospective customers to make buying decisions - what they called customer indecision - while only 44% resulted from a preference for the status quo. This research also found that 87% of sales opportunities contained moderate or high levels of customer indecision.

Dixon and McKenna argued that overcoming customer indecision requires a different "playbook" than the one used to overcome the status quo bias. As they wrote, "Where overcoming the status quo is about dialing up the fear of not purchasing, overcoming indecision is about dialing down the fear of purchasing."

The authors' research found that top performing sales reps use four distinct behaviors - which they call the JOLT Method - to overcome customer indecision.

  • "Judge the level of customer indecision" - Top sales reps assess the level of customer indecision that exists in every sales opportunity and qualify opportunities based on those assessments.
  • "Offer their recommendations" - The most successful sales reps will - at the appropriate point in the sales process - recommend what the prospective customer should buy.
  • "Limit the exploration" - Top performing sales reps recognize that prospective customers can easily become overloaded with information and that the result of information overload is often "analysis paralysis." Therefore, they use information selectively to guide prospective customers to the best decision possible.
  • "Take risk off the table" - High-performing sales reps offer prospective customers "safety nets" that reduce the risks associated with making a purchase.
Marketers Must Also Focus on Customer Indecision
While Dixon and McKenna focused on how sales reps can reduce customer indecision, it's important to recognize that marketing also has an important role to play in helping potential buyers feel confident enough to make a purchase decision.
Buyer decision confidence has three major components.
  1. Confidence in the specific product or service under consideration
  2. Confidence in their company's ability to successfully implement any organizational changes required to reap the full benefits of the product or service purchased
  3. Confidence in the soundness of the process used to make the purchase decision
Because business buyers are increasingly relying on content to support their evaluation of potential purchases, B2B marketers should develop content resources that will nurture all three components of buyer decision confidence. For a closer look at the importance of buyer decision confidence and how marketers can nurture it, see this earlier post.
***
Dixon and McKenna have also written a book that provides a much deeper discussion of the issues covered in the HBR article. The Jolt Effect:  How High Performers Overcome Customer Indecision will be released in September. I've pre-ordered a copy, and I plan to review the book this fall.

Image courtesy of Dan Moyle via Flickr (CC).


Sunday, July 24, 2022

Research Reveals Some of the Nuances of Purpose Marketing

Source:  Shutterstock

In January of this year, I published a lengthy article here discussing the topic of purpose marketing, which can be defined as the use of content in external communications that emphasizes a company's core mission and values, i.e. its brand purpose.

A company's brand purpose describes its "reason for being" beyond the basic business functions of offering products or services and earning a profit. The brand purpose encompasses how the company is making a positive contribution to society and where the company stands on important social issues.

For the past few years, marketers have been inundated by research studies purporting to prove that consumers and business buyers now place great importance on the social responsibility track record of the companies they do business with. Many of these studies also indicate that buyers now expect companies and brands to "take a stand" on important social issues. As a result, many marketers have become enamored with purpose marketing.

As I wrote back in January, the decision to use purpose marketing is far more nuanced than the current tsunami of hype would suggest. Fortunately, three recent surveys provide a more balanced view of consumer attitudes regarding the importance of corporate social responsibility and brand purpose. The findings of these surveys show that while values matter to consumers, their expectations of companies and brands are mixed.

The Collage Group Survey

Last fall, Collage Group surveyed 4,140 American adults (ages 18-75) regarding a wide range of issues. The data presented in the survey report were weighted to be nationally representative of race/ethnicity, Hispanic acculturation, age, gender and sexuality.

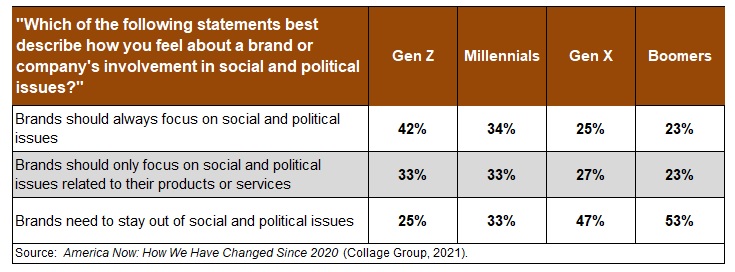
The Collage Group survey revealed little consensus among American consumers regarding the proper role of companies and brands in social issues. Only 30% of the survey respondents said companies/brands should always focus on social and political issues. Another 28% said they should only focus on those issues that are related to their products or services. And 42% of the respondents said companies/brands need to stay out of social and political issues.

Not surprisingly, younger consumers are more likely to believe that companies/brands should always focus on social and political issues. The following table shows how survey responses varied across four generational cohorts.


The YouGov Survey

Recent research has also provided insights regarding how much importance consumers place on brand values when making purchase decisions. In August of last year, YouGov surveyed consumers in 17 global markets. The researchers asked survey participants whether they prioritized price or brand values when making purchases in eight industry verticals. The following table shows how the survey participants responded.


As this table shows, more consumers prioritize prioritize price than prioritize a brand's values when making purchases in all eight industry sectors.

The Merkle Survey

When it comes to consumers' expectations of companies/brands regarding social responsibility, it shouldn't be surprising that consumers place more importance on some actions than others. In an October 2021 survey of 1,000 U.S. consumers by Merkle, researchers provided survey participants a list of eight actions and asked participants to rate the importance of those actions. The following table* shows the percentage of survey respondents who rated each action as very important. 


As the above table shows, the members of this survey panel were most concerned about how companies treat their employees. The only two actions a majority of survey respondents deemed very important were treat employees fairly and keep workers safe. It's also noteworthy that only 16% of the survey respondents said it is very important for companies/brands to take a stand on political issues.  

The Takeaway

The findings of these three surveys do not demonstrate - or even suggest - that purpose marketing is a bad idea. But they do show that the decision to make purpose marketing part of your marketing strategy isn't as clear cut or simple as the current hype would suggest.

*The data in the table is based on a description of the Merkle survey results contained in a report by eMarketer titled, "Spotlight:  What Values-Driven Consumers Really Want."

Sunday, July 17, 2022

[Research Round-Up] NetLine Report Examines B2B Content Consumption

 (This month's Research Round-Up is devoted exclusively to the latest B2B content consumption report from NetLine Corporation. NetLine publishes this report annually, and it consistently provides a wealth of real-world insights regarding how business professionals actually consume content.)

Source:  NetLine Corporation
Over the past two decades, content marketing has become one of the most widely used techniques in B2B marketing. Today, virtually all B2B companies are using content marketing in some form.

Ironically, the popularity of content marketing has make successful content marketing more difficult to achieve. As companies produce more and more content, the total volume of content available to potential buyers increases exponentially. And so does competition for buyer attention and mindshare.

In these circumstances, understanding how business professionals actually consume content is critical to success. The 2022 State of B2B Content Consumption & Demand Report by NetLine Corporation provides numerous valuable insights on this vital issue.

NetLine operates a content syndication platform, and this report is based on data about 4.6 million content registrations that occurred on the NetLine platform in 2021. This research is particularly valuable for two reasons:

  1. It captures the real-world content consumption behaviors of business professionals. The data used for the NetLine report was not derived from a survey or interviews, but from actual engagements with B2B content.
  2. The report is based on first party data. The business professionals who use the NetLine platform voluntarily share information about themselves and the organizations they work for in exchange for access to the content resources available on the  platform.
NetLine tracks content consumption for more than 400 job functions, 24 industries and organization size. Therefore, the NetLine report produces a wealth of detailed information about content consumption behaviors, and I encourage you to review the full 65-page report. Here are a few of the report's highlights.
Content Consumption Continues to Grow
Overall B2B content consumption in 2021 increased more than 9% compared to 2020 levels. Last year's growth followed a 22% increase in 2020 compared to 2019. So overall consumption was up 33% in 2021 compared to 2019. Content consumption by C-level executives is also on the rise, growing by 15.8% in 2021 compared to 2020. In 2021, C-level executives represented 14.8% of NetLine's total audience.
Most Popular Content Formats
The ten most requested types of content on NetLine's platform in 2021 were:
  1. eBooks
  2. Guides
  3. Cheat Sheets
  4. Tips and Tricks Guides
  5. White Papers
  6. Research Reports
  7. Kits
  8. Webinars
  9. Checklists
  10. Articles
Collectively, these ten content formats accounted for 87% of all content registrations on the NetLine platform last year. The three most popular formats - eBooks, guides and cheat sheets - accounted for more than 60% of total registrations in 2021, and eBooks alone accounted for more than 43% of total registrations.
Measuring the Consumption Gap
One of the most useful insights provided by the NetLine report relates to the consumption gap, which NetLine defines as the time between the moment content is requested and the moment it's opened for consumption. This data point is important because it should be used to guide the timing of follow-up contacts with potential buyers. After all, it makes little sense to contact a potential buyer about a content resource before he or she has actually reviewed the content.
In 2021, the average consumption gap across all job categories was 33.3 hours, up from 29.7 hours in 2020.
eBooks vs. White Papers
NetLine's data regarding eBooks and white papers illustrate why marketers must consider multiple factors when evaluating the performance of content assets. As noted earlier, eBooks accounted for just over 43% of all content registrations on NetLine's platform last year. Meanwhile, white papers represented only 7.41% of all content registrations.
Clearly, eBooks are far more popular overall with business professionals than white papers, and marketers might be tempted to stop producing white papers based on this data. However, NetLine's analysis also found that business professionals who registered to access white papers were more likely than other registrants to be expecting to make a purchase in the following 12 months.
Therefore, the consumption of white papers is a strong indicator that a potential buyer is actively "in-market" and expects to make a purchase in the relatively near future. NetLine found that on-demand webinars and live webcasts were also good indicators of short-term purchase intent.
Beyond functioning as a good indicator of purchase intent, white papers and other more "weighty" content formats play an important role in the later stages of the buying process. As potential buyers more further into their buying process, they tend to seek more detailed information, and information-rich content resources such as white papers fill this need.
***
Content marketing is a vital part of the marketing strategy at most B2B companies, and the NetLine report provides data that marketers can leverage to improve the performance of their content marketing efforts.

Sunday, July 10, 2022

[Book Review] "The Right Way To Select Technology"

Source:  Rosenfeld Media, LLC

It's been crystal clear now for several years that marketing and technology have become deeply entwined, and that the number of marketing-related technologies has been growing at an exponential rate. The inaugural (2011) version of Scott Brinker's marketing technology landscape graphic contained about 150 solution providers. The 2022 version of the graphic includes nearly 10,000 technology solutions. So, the marketing technology landscape has grown by an astounding 6,521% since 2011. 

Because of the growing reliance on technology, marketing leaders are acquiring new technology tools on a fairly regular basis. In a 2021 survey of marketers by MarTech, two-thirds (67%) of the survey respondents said their organization had replaced at least one marketing technology application in the previous 12 months.

There are an abundance of resources that provide advice on how to select new technology. For example, many technology vendors produce buying guides for the types of technologies they offer, and several analyst/consulting firms regularly publish "rankings" of various types of technology applications.

One of the best resources for marketers is The Right Way To Select Technology by Tony Byrne and Jarrod Gingras (Rosenfeld Media, LLC, 2017). Tony Byrne is the founder and Jarrod Gingras is the Managing Director of Real Story Group, a buy-side technology research and advisory firm. It works exclusively with enterprise customers, and the firm emphasizes that its advice is vendor agnostic.

The Right Way To Select Technology provides a detailed road map for making sound technology buying decisions, and it contains a wealth of practical suggestions and tips. The book focuses primarily on information technologies that an enterprise acquires to improve customer or employee digital experiences. However, the authors note that the methodology described in the book can be used for selecting any information technology.

What's In the Book

The Right Way To Select Technology contains six major parts.

Part I (Chapters 1-3) - In Part I, the authors discuss the "business foundations" that are essential for making smart technology buying decisions. They argue that a realistic business case is needed for prospective technology acquisitions, they describe the importance of choosing an appropriate selection team, and they explain why the selection team needs to determine how decisions will be made before the selection process begins.

Part II (Chapters 4-6) - Part II of the book focuses on how companies identify the business needs and articulate the "requirements" associated with a proposed technology purchase. In Chapters 4 and 5, the authors introduce the idea of using principles of user-centered design in the technology selection process, and they argue that user stories should be a core component of the process. Chapter 6 outlines the kinds of questions that the selection team should be asking prospective vendors.

Part III (Chapters 7-9) - In this part, Byrne and Gingras describe how technology selection teams can ensure they identify the right vendors to consider, and they explain how companies can decide which solicitation vehicle (request for information vs. request for proposal vs. request for quote) will work best for their situation.

Part IV (Chapters 10-12) - Chapters 10 and 11 discuss how selection teams can interact effectively with prospective vendors, including how to create RFI's/RFP's/RFQ's that actually work and how to respond to vendor questions. Chapter 12 explains how selection teams should review vendor submissions and how they should approach the task of reducing the number of vendors under consideration.

Part V (Chapters 13-14) - In this part, Byrne and Gingras cover two of the most important steps in the technology selection process. In Chapter 13, the authors describe how to structure and conduct demo sessions that will provide the selection team relevant and useful information. Byrne and Gingras strongly argue that selection teams should include a competitive proof of concept - a "bake-off" - in their selection process. A bake-off would typically involve two vendor finalists. Chapter 14 explains how to design and conduct an effective bake-off.

Part VI (Chapters 15-17) - The book concludes with chapters that explain now to effectively negotiate with vendors, how to make the final selection, and how to adapt the process described in the book when selecting a services firm such as a consulting firm or a systems integrator.

My Take

The Right Way To Select Technology is a must-read for anyone who is responsible for acquiring information technology solutions for their organization. The book is well organized and clearly written, and it covers the technology selection process in a comprehensive and practical way.

The central theme of the book is that the most important goal of business leaders and managers in any technology selection process is to identify the vendor and solution that will be the "best fit" for their organization.

The emphasis on choosing best-fit technologies is present in virtually all of the steps of the selection process described in the book, but it plays the starring role in how the authors approach expressing the requirements for a new technology tool.

Byrne and Gingras recommend capturing requirements primarily through user stories. A user story is a short, real-world narrative that describes a company's available data, work processes, business needs and desired business outcomes.

A user story speaks from the perspective of a specific user persona, which can be defined as an archetype of a type or group of users. Users will always include certain company employees, but for some types of technologies, users could also include customers, suppliers and/or channel partners.

User stories enable the technology selection team to capture how real people will interact with a technology application and what they need to accomplish.

Selecting the right technology tools is now one of the most important responsibilities of business leaders, including marketing leaders. That's what makes The Right Way To Select Technology a valuable resource and a must-read.