Showing posts with label Marketing ROI. Show all posts

Sunday, August 17, 2025

Six Key Steps to Winning CFO (and CEO) Support for Increased Investment in Brand Marketing


After languishing in the shadow of performance marketing for more than two decades, B2B brand marketing is experiencing a renaissance. The number of blog articles, LinkedIn posts, and other forms of content highlighting the importance of having a strong B2B brand has increased dramatically over the past couple of years.

This growing interest in B2B brand building can be attributed to several factors. For one thing, many B2B marketers are finding that demand generation/performance marketing tactics that worked well only a few years ago have become less and less effective.

In addition, recent research studies by The B2B Institute, Bain & Company, Google, 6sense, and others have provided insights about the B2B buying process that make the value of a strong B2B brand abundantly clear.

Despite the increased attention on B2B brand building, many marketers are reporting that it's still difficult to win support from their CFO and CEO for increased investments in brand marketing programs.

In response to this challenge, several marketing pundits have published articles or guides advising marketing leaders on how to "sell" brand marketing to senior company leaders, particularly the CFO.

One of the better resources I've seen recently is "Selling brand marketing budgets to the CFO:  proof, not promises" by Wynter, a provider of B2B brand tracking and research software. This article describes five steps B2B marketing leaders should take to make their proposed brand marketing spending more likely to win support from their CFO.

Here are Wynter's five steps:

  • Link brand investments to improved financial outcomes such as increased revenue, market share, and profit margin.
  • Incorporate specific, quantifiable KPIs and targets in the budget proposal.
  • Include competitive benchmarks whenever possible. What are your primary competitors spending on brand marketing? How does the health of your brand compare to that of your competitors?
  • Make the risks of under-investing in brand explicit.
  • Spell out when the proposed brand investments will produce results. In other words, provide a realistic ROI timeline that's supported by credible evidence.
I agree with these specific recommendations, but I have a couple of concerns about the section of the Wynter article that discusses "modeling brand ROI."
First, the article makes developing a credible, evidence-based quantitative model that shows the financial benefits of brand marketing appear to be simpler than it actually is.
And second, this portion of the article uses the term "brand ROI" in an overly broad way, which can make it more difficult for marketing leaders to win the support of their CFO for greater investment in brand marketing.
When You Say ROI . . . Mean ROI (The Sixth Step)
For years, many marketers have used "ROI" as a catch-all term to describe the value of a wide range of benefits produced by marketing activities, including brand marketing activities. Unfortunately, this practice has been perpetuated by marketing pundits and other industry participants who should know better.
Advocates of brand marketing forcefully argue that a strong brand produces several valuable benefits, including:
  • Increased share of branded search (an indicator of brand awareness and possible purchase interest)
  • Increased response and conversion rates from "performance marketing" programs
  • Increased presence in "day-one consideration sets"
  • Lower customer acquisition costs
  • Increased market share
  • Increased revenue (total revenue, not gross margin)
When some or all of these benefits are supported by credible evidence, marketing leaders should include them when discussing increased investment in brand marketing with their CFO. However, none of these benefits constitutes ROI.
Return on investment is a specific financial metric that has a well-established meaning among management and financial professionals. It's a ratio that compares the incremental financial gain from an investment (the "return") to the amount of the investment.
When marketing leaders use "ROI" to describe anything else, they can quickly lose credibility with their CFO, and probably with their CEO as well. If a marketing leader displays a fundamental misunderstanding of this basic financial metric, why should a CFO rely on any other financial estimates or projections the marketing leader provides?
The lesson here is clear:  If you're a marketing leader, you need to be careful to calculate and use financial metrics in ways that trained financial professionals (like CFOs) will see as proper. This will enhance your personal credibility with your CFO and make it more likely that he or she will support your proposed marketing plans.

Image courtesy of Limelight Leads via Flickr (CC).

Sunday, March 2, 2025

Cracking the Code on Strategic ABM Success


 The Story of ABM

Over the past two-plus decades, account-based marketing (ABM) has evolved from a niche marketing discipline used mainly by large IT services firms to become a core component of marketing at many B2B companies.

The Information Technology Services Marketing Association (ITSMA) (now part of Momentum) coined the term "account-based marketing" in 2003, and ABM soon became a central focus of its research and consulting.

ITSMA defines account-based marketing as ". . . a strategic approach to designing and executing highly-targeted and personalized marketing programs to drive business growth and impact with specific, named accounts." [Source]

The popularity of account-based marketing has grown dramatically because B2B marketers perceive that ABM is highly effective. In the 2023 Global State of Account-Based Marketing survey by ITSMA and ABM Leadership Alliance, 81% of the respondents said ABM programs deliver a higher return on investment than "traditional marketing initiatives."

As originally conceived, ABM was viewed as a special approach to marketing that would be used with a company's most valuable customers. Within a few years, however, the successes achieved by early ABM adopters prompted marketers to look for ways to scale account-based marketing so that it could be cost-effectively used with a broader range of accounts.

In its 2016 Account-Based Marketing Benchmarking Survey, ITSMA documented the rise of three distinct types of ABM - strategic ABM (a/k/a one-to-one ABM), ABM Lite (a/k/a one-to-few ABM), and programmatic ABM (a/k/a one-to-many ABM).

This three-part framework has become the standard way to describe account-based marketing, but the reality today is that one-to-few and one-to-many ABM aren't materially different from state-of-the-art conventional outbound B2B demand generation marketing.

This is not true for strategic ABM, which embodies a very different marketing approach. With strategic ABM, marketing activities and programs are components of a multi-faceted management plan for a single customer account, and they are customized for that account.

Strategic ABM Still Rules

While one-to-few and one-to-many ABM have broadened the reach of account-based marketing, the linchpin of any successful ABM initiative is still strategic ABM.

Strategic ABM remains the most widely-used type of account-based marketing, and most ABM thought leaders and practitioners agree that strategic ABM - if done well - will generate a higher ROI than one-to-few or one-to-many ABM. Put simply, it's hard to have a high-performing ABM program if don't master strategic ABM.

The functional centerpiece of a successful strategic ABM initiative is the account management plan. With strategic ABM, a separate plan is developed for each account in the initiative. This is the first distinguishing characteristic of strategic ABM. It's truly one-to-one.

An effective strategic ABM account plan is also distinguished by the process used to develop it and the content it contains.

Developing the Plan(s)

Strategic ABM is often implemented in companies that already have a key account management (KAM) program. Key account programs have existed in some large B2B companies since the late 1950s. Early KAM programs were usually led by a sales executive, and their primary focus was managing sales opportunities.

The discipline of key account management has evolved substantially over the past six decades. Many companies now have well-developed KAM programs that are designed and executed by cross-functional account teams, and led by dedicated, senior-level account managers.

Today, the best KAM programs are focused on identifying longer-term growth opportunities in the account and maintaining the long-term health of the customer relationship, as well as on shorter-term sales opportunities.

In these circumstances, strategic ABM is essentially synonymous with key account management. A marketer becomes a member of the account management teams (usually no more than 5) and brings marketing expertise to the formulation of the account management plans. ABM activities are fully integrated into the account management plan so that the company has a single, cohesive strategy and plan for each key account.

Content of the Plan(s)

An effective strategic ABM/KAM account management plan is essentially a full-fledged business plan that is focused on an individual customer. The objective of the account planning process is to formulate a strategy and set of actions that will (a) protect the current revenue you are earning from the customer, and (b) enable you to grow the revenue you earn from the customer.

I used the term "business plan" intentionally because an effective strategic ABM/KAM plan is similar to the kind of business plan you would develop for any strategic move, such as the introduction of a new product or service, or an adjacent market expansion.

You can easily find dozens of business plan templates by performing a simple Google search. The framework that I've found works well for an account management plan contains six major components.

Customer Description

The objective of this portion of the plan is to provide a comprehensive picture of the customer's business operations, competitive position, organizational structure, and financial performance.

This portion of the plan should describe:

  • The market(s) the customer serves and the economic attractiveness and growth potential of those markets
  • The products and/or services the customer offers
  • The types of individuals and/or organizations the customer primarily serves
  • The customer's principal competitors
  • The customer's current and recent financial performance
  • The customer's business strategy and strategic priorities
  • Any recent or planned structural changes (expansions or contractions)
  • The customer's senior leadership team
If the customer is a public company, much of this information, including financial performance data, can be obtained from the customer's regulatory filings. If the customer is privately owned, financial data can be more challenging to obtain.
A mindset that I've found useful when preparing this portion of an account plan is to imagine that you are a stock analyst who is preparing an evaluation of the customer for investment purposes.
Current Relationship
This portion of the plan is where you describe your current position with the customer. What products and/or services do you sell to the customer? How long have you been doing business with the customer? How has the revenue you earn from the customer changed over the past 2-3 years? Who are your principal competitors for the customer's business? How strong is your current relationship with the customer? Most importantly, what "share of wallet" are you currently earning from the customer?
Relationship Objectives
This portion of the plan details your objectives for the relationship with the customer. Most of these objectives will be about increasing the revenue you earn from the customer, and those objectives are usually best expressed in terms of increasing the share of customer spend you earn in relevant areas.
You may also want to include more "operational" objectives. For example, if the customer has several business units and you are currently doing business with only some of those business units, you may have an objective to win business from a new business unit.
Threats/Barriers to Success
This is where you identify the events or circumstances that could throw a wrench into your plan. Obviously, you can't foresee every possible threat or barrier, but if you have deep customer insights and a realistic picture of your company's capabilities, you can identify many of the plausible events or circumstances that could derail your success.
Measurable Outcomes and Milestones
Every account management plan should include specific outcomes that are quantitatively measurable. Obviously, these outcomes will include your ultimate relationship objectives. For example:  "Increase the revenue we earn from XXX by 15% in our next fiscal year." You should also include measurable outcomes that are milestones or leading indicators of progress toward your ultimate objectives.
Action Plan
This portion of the account plan details the actions you will take to achieve your relationship objectives. Your account plan should identify who is responsible for each action and specify a target completion date. This level of detail will enable the members of your account management team to organize their work, hold each other accountable, and track progress toward success.

Final Thoughts
It should be clear that developing this type of account business plan isn't a trivial undertaking. It requires a significant amount of time and effort, especially the first time it's done for a customer. That's why strategic ABM/KAM initiatives should be reserved for your most valuable customers.
The deep customer insights and level of focus resulting from the account planning process also go a long way to explaining why well-designed and executed strategic ABM/KAM programs deliver outstanding value and ROI.

Image courtesy of emiliokuffer via Flickr (CC).

Sunday, August 18, 2024

[Research Round-Up] Salesforce Survey Examines the State of Marketing

Source:  Salesforce

(This month's Research Round-Up focuses exclusively on the latest edition of the State of Marketing survey by Salesforce. The new Salesforce survey is a large global survey of B2B and B2C marketers, so it provides a broad perspective on the priorities, challenges, and attitudes of the marketing community.)

Salesforce recently published the findings of its latest State of Marketing survey. The latest survey is the ninth edition of the Salesforce research. It was in the field February 5 - March 12, 2024.

Survey Demographics

  • The survey produced 4,850 responses from marketing decision-makers
  • Respondents were drawn from 30 countries across North America, Latin America, Asia-Pacific, and Europe
  • Respondents worked in 18 industry verticals
  • 50% of the respondents worked in B2C companies, and 50% worked in B2B or B2B2C companies
  • 39% of the respondents were VP-level or above
  • 50% of the respondents were with mid-market companies (101 - 3,500 employees), 30% were with small and medium-sized companies (1 - 100 employees), and 20% were with large enterprises (over 3,500 employees)
Marketing Performance Levels
Salesforce classified survey respondents based on their self-reported level of marketing performance and used these categories to report some survey findings. The three categories used in the survey report are:
  • High performers - Respondents who were completely satisfied with the overall outcomes of their marketing investments.
  • Moderate performers - Respondents who were highly satisfied with the overall outcomes of their marketing investments.
  • Underperformers - Respondents who were moderately or less satisfied with the overall outcomes of their marketing investments.
Marketers' Top Priorities and Challenges
Salesforce asked survey participants to identify their top priorities and biggest challenges, and the following table shows how respondents answered those questions.


It shouldn't be surprising that survey respondents identified "implementing or leveraging AI" as their top priority and their biggest challenge. Artificial intelligence, particularly generative AI, has been the hottest topic in marketing since OpenAI released ChatGPT in late 2022.
It's also notable, but not surprising, that the top priorities and the biggest challenges are nearly identical. These survey respondents clearly believe that for marketing to have the greatest possible impact on the business, they must successfully address their biggest challenges.
The State of AI
The survey revealed that the implementation of AI is still in its early stages. Thirty-two percent of all respondents said they have fully implemented AI in their operations.
Salesforce did find that high performers were 2.5x more likely than underperformers to have fully implemented AI. Forty-two percent of high performers said they have fully implemented AI, compared to only 17% of underperformers.
The survey also asked participants how they were using or planned to use AI, and the top five use cases identified by respondents were:
  1. Automating customer interactions
  2. Generating content
  3. Analyzing performance
  4. Automating data integration
  5. Driving best offers in real time
While marketers are excited about the potential benefits of AI, they also have concerns about embracing the technology, particularly generative AI. The top five concerns about generative AI identified by survey respondents were:
  1. Data exposure or leakage
  2. Lack of necessary data
  3. Lack of strategy or use cases
  4. Inaccurate outputs
  5. Copyright or intellectual property concerns
The State of  Marketing survey also provides valuable data on several other topics, including:
  • The strategies and sources marketers are using to collect customer data
  • Where and how much marketers are using personalization in their marketing programs
  • How marketers are measuring marketing performance
The Salesforce State of Marketing survey is one of the research studies I pay attention to every year. I wish Salesforce provided a breakdown of responses between B2B vs. B2C companies and by country (or at least region), but even without this more granular reporting, the survey still provides important insights.

Sunday, July 30, 2023

Not Everything In Marketing Can Be Measured


In a recent article for martech.org, Christopher Penn wrote, "Everything in marketing is measurable, from top to bottom, from brand to customer satisfaction to purchase - you can measure 100% of marketing." He argued that when people say some aspect of marketing can't be measured, they mean that, ". . . they don't have the budget and resources to measure what they care about." 

Christopher Penn is the Chief Data Scientist of Trust Insights and the author of AI For Marketers:  An Introduction and Primer, which I recently reviewed. He's a recognized authority on artificial intelligence and data science, so I'm reluctant to disagree with him on anything relating to marketing analytics. But, I have a different view on this issue.

Every marketing channel, tactic, or program can be measured in some ways, but not everything about every marketing activity is measurable.

Despite what you've heard and read, you can't actually measure the financial impact of most individual marketing channels, tactics, and programs. The financial performance of these aspects of marketing can be modeled if you have the right data, tools, and skills. However, the information produced by a model is qualitatively different from the information obtained through measurement.

Measurements vs. Models

Measurement can be defined as the process of quantifying some property of an object or event. In marketing, we can measure the number of visits to a website, the number of e-mail opens and click-throughs, and the number of times a particular content resource is downloaded.

We can also measure the duration of events, such as how long someone spends on a web page. The common denominator in these and all other measurements is that they are based on observations of actual objects or events.

A model, on the other hand, is a simplified representation of a process or system created using statistical principles and mathematical equations. The usual purpose of a model is to describe the current or past behavior of a system or process or to predict its future behavior.

Because models rely on statistical rules and mathematical calculations rather than observations of actual things or events, model outputs are inevitably approximations or estimates of what exists or occurs in the real world.

A model that is properly designed and trained using a sufficient amount of the right data can produce reasonably reliable outputs, but there is always a "margin of error." In short, a statistical model, despite the appearance of mathematical precision, will always be more like an impressionist painting than a photograph.

Why Financial Impact Can't Be Measured

The financial impact of most individual marketing channels, tactics, or programs can't be measured because it can't be observed. To determine the financial impact of these aspects of marketing, you would first need to determine how much of customers' buying decisions were due to the channels, tactics, or programs you're trying to value. And there's just no reliable way to observe that causal effect.

It's tempting to think you could use a survey to ask customers about the impact of various marketing channels, tactics, and programs on their buying decisions. After all, customers should be able to tell you what caused them to make a particular purchase decision. To understand why this approach doesn't work, consider this thought experiment.

Below are the ingredients used to make Nestle's famous "Toll House" chocolate chip cookies:

  • 2 1/4 cups all-purpose flour
  • 1 tsp baking soda
  • 1 tsp salt
  • 2 sticks butter
  • 3/4 cup granulated sugar
  • 3/4 cup packed brown sugar
  • 1 tsp vanilla extract
  • 2 eggs
  • 2 cups Nestle Toll House Semi-Sweet Chocolate Morsels
  • 1 cup chopped nuts
Suppose that these are your favorite cookies - you really love them. If I gave you this recipe and asked you to tell me how much of your enjoyment each ingredient is responsible for, how would you answer? What percentage of your enjoyment is due to the flour? The salt? The brown sugar?
I suspect you would say my question is impossible to answer, and you would be right. That's because your enjoyment - the "value" of the cookies - arises only when all of the recipe's ingredients are combined, and there's no accurate way to attribute a percentage of the enjoyment/value to individual ingredients.
The same is true of buying decisions. A customer's decision to buy results from the combined effect of all the interactions and experiences that occurred during the customer's buying cycle, and there's no realistic way to observe the mental impact of any individual interaction or experience. And, since those impacts can't be observed, they can't be measured.
The financial impact of individual marketing channels, tactics, and programs can be modeled using marketing mix modeling and multi-touch attribution modeling, but marketers need to remember that the outputs of such models are only approximations of reality and treat them accordingly when making decisions.

Image courtesy of Pat Pilon via Flickr (CC).

Sunday, February 27, 2022

[Deep Dive] For Better Marketing Measurement - Draw a Map


Image Source:  Shutterstock

Key Takeaways

Marketing leaders are facing constant demands to improve marketing performance and prove the business value of marketing activities. To meet these demands, marketing leaders need an effective marketing measurement system, but measuring marketing performance has been a perplexing challenge for decades, and it remains a significant issue today.

In this article, we'll explain - 

  • Why the key to building a robust marketing measurement system is to tie the system to your marketing strategy
  • How to use a marketing strategy map to describe your strategy in measurable terms and link your marketing activities to business value
Marketing Measurement is Still a Challenge
The persistent and growing demands for greater accountability from marketing has resulted in a huge volume of literature describing how to measure marketing performance. Marketing industry pundits have addressed the topic from almost every conceivable angle in dozens of ebooks, white papers, articles and presentations.
Despite all this attention, recent research indicates that many marketers aren't satisfied with their marketing performance measurement system. In the 2021 Marketing Measurement & Attribution Survey by Demand Gen Report, 58% of B2B marketing executives said their company's ability to measure and analyze marketing performance is poor/inadequate or needs improvement.
Marketers attribute their dissatisfaction to a variety of specific factors, including data and technology issues. But it's increasingly apparent that many marketers need to take a fresh look at how they're approaching the task of measuring marketing's performance and value.
The Key to Meaningful Marketing Measurement
The key to building an effective marketing measurement system is to tie the system directly to the company's marketing strategy. In other words, the measurement system should be designed to measure how well the marketing strategy is working. That's because the performance of marketing and its ability to add value to the business are largely dependent on the quality and execution of the marketing strategy.
Deriving marketing metrics from marketing strategy is also the right approach because a company's marketing strategy is ultimately defined by what marketing activities it chooses to perform, how it chooses to perform those activities, and how those activities relate to and reinforce one another. Therefore, marketing activities are the building blocks of marketing strategy, and marketing strategy is the essential connective tissue that links marketing activities to business value.
This approach has several implications for marketing leaders. Most importantly, it means they will need to describe their marketing strategy in measurable terms before they select specific marketing metrics.
The Architecture of a Marketing Strategy Map
The best tool for describing a company's marketing strategy in measurable terms is a marketing strategy map. A strategy map is simply a diagram that depicts the marketing objectives and activities that constitute the major elements of a company's marketing strategy.
These objectives and activities are arranged in a hierarchy of linked cause-and-effect relationships. A marketing strategy map makes these relationships and dependencies visible, and therefore it will enable marketing leaders to measure how well their strategy is working.
In this post, I'll describe the basic architecture of a marketing strategy map. Every company's strategy map will be unique because every company's marketing strategy is unique. In this discussion, I'll cover components that appear in most marketing strategy maps, and I'll use others for illustrative purposes.
To keep the length of this post manageable, my discussion will focus on a vertical "slice" of a complete marketing strategy map. This will allow me to describe the full "depth" of a strategy map and demonstrate how it enables marketing leaders to connect marketing activities to strategic business outcomes.
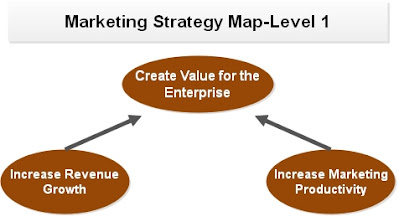
The most effective way to build a marketing strategy map is to use a top-down approach. In virtually all companies, the ultimate goal of marketing is to create value for the enterprise, so that objective is placed at the top of the strategy map, as shown in the following diagram.


Marketing can create value for the enterprise in two basic ways - by driving revenue growth and by increasing the productivity of the marketing function. A sound marketing strategy will seek to create value in both ways. Therefore, most marketing strategy maps will include both a revenue growth objective and a marketing productivity objective, as the diagram shows.
A marketing strategy map also makes the "logic" of the strategy clear. In the above diagram, the directional arrows indicate that the hypothesis of the strategy is that marketing will create value for the enterprise if it drives revenue growth and improves marketing productivity.
Most marketers will use return on marketing investment to measure marketing's contribution to the value of the enterprise. Revenue growth is often measured using the year-over-year percentage growth rate. Marketing productivity can be measured in several ways, but one of the better metrics is the revenue turnover ratio. This ratio is calculated by dividing total annual revenue by total annual marketing costs.
The balance of this post will focus on the revenue growth side of a marketing strategy map, part of which is depicted in the following diagram.


Virtually all companies have access to four structural sources of organic revenue growth.
  1. Continuing sales to existing customers (customer retention)
  2. Increased sales to existing customers
  3. Sales to new customers in existing markets
  4. Sales to new customers in new markets
The marketing strategies of most companies will include objectives for most, if not all, of these sources of revenue growth, as the above diagram illustrates.
Marketers can use a variety of metrics to measure their success at achieving these revenue growth objectives. For example:
  • For continuing sales to existing customers - annual customer churn rate
  • For increased sales to existing customers - share of wallet (in the relevant category)
  • For sales to new customers in existing markets - 
    • Number of new customers acquired in existing markets
    • Revenue from new customers acquired in existing markets
  • For sales to new customers in new markets - 
    • Number of new customers acquired in new markets
    • Revenue from new customers acquired in new markets
Once again, a marketing strategy map uses directional arrows to make the logic of the marketing strategy clear. If marketing successfully drives revenue from a combination of these growth sources, it will achieve its overall revenue growth objective.
It's important to make three points concerning the four revenue growth objectives shown above. First, some marketing leaders will use more specific versions of these growth objectives if their marketing strategy is more targeted. For example, if company leaders believe that acquiring new customers in certain industry sectors is an attractive growth opportunity, marketing leaders may use objectives and metrics that are specific to those industry sectors.
Second, marketing leaders will place different priorities on these four growth objectives based on the market and competitive conditions their company is facing. And third, some marketing leaders may not use all four growth objectives. For example, some companies may have no current plans to enter a new market.
The marketing objectives I've discussed so far would be appropriate for most companies. The remaining objectives will be more company specific because they are dependent on what a company sells, the attributes of the buying process used by the company's prospects and customers, and the specific marketing tactics the company plans to use.
The following diagram shows an illustrative set of marketing objectives that relate specifically to one of the growth objectives previously discussed - acquiring new customers in existing markets.


The marketing strategy depicted in this diagram is focused on three objectives - increasing brand awareness, increasing the level of buyer engagement, and increasing the number of qualified sales opportunities. The logic of this strategy can be described as follows:
  • Increasing brand awareness will result in an increased level of buyer engagement with the company.
  • Increasing buyer engagement will increase the number of qualified sales opportunities available to the company.
  • Increasing the number of sales opportunities will increase the number of new customers the company acquires and increase revenue from new customers
The final component of a marketing strategy map is a description of the types of activities marketing leaders will implement to achieve the identified objectives. Each marketing activity is linked to the objective or objectives marketing leaders believe the activity will impact.
For this discussion, I'm using one marketing activity - blogging - to illustrate how to address marketing activities in a strategy map. In the above diagram, blogging is designed to increase brand awareness and to increase buyer engagement. The logic of marketing leaders would be:  If we increase the quantity and quality of the content published at our blog, we will increase the awareness of our company and/or brand by potential buyers, and we will also increase engagement by potential buyers.
Marketers can use several metrics to measure brand awareness and buyer engagement. Some examples are:
  • For brand awareness - 
    • Share of search
    • Brand health surveys
  • For buyer engagement  - 
    • Number of website visitors
    • Number of content views/downloads
    • Time spent with website content
Marketers also have several options for measuring the specific performance of their blog. These could include number of pageviews and shares of blog content on social media.
Of course, marketing leaders will implement other types of marketing programs to drive increased brand awareness and increased buyer engagement. A complete marketing strategy map will include all of the types of marketing activities that are part of the marketing strategy, and those activities will be linked to one or more marketing objectives.
The Most Important Benefit of a Marketing Strategy Map
A marketing strategy map provides several benefits, but the greatest benefit is that it helps marketing leaders solve one of the most difficult challenges associated with marketing performance measurement.
 Marketing creates business value through activities that operate at different stages of the value creation process. The problem is, many marketing activities contribute to business value only indirectly, and some will be several steps removed from the economic outcomes they affect. Under these circumstances, it's difficult for marketing leaders to show the financial value of such "remote" marketing activities.
When marketing leaders build a strategy map, they create a chain of linked marketing activities and objectives that makes it possible to connect marketing programs to top-level business outcomes in measurable ways.
The following diagram illustrates how a marketing strategy map can be used to prove the value of a "remote" marketing activity, in this case blogging.


It would be very difficult to prove that blogging has an impact on enterprise value because the direct relationship (the correlation) between blogging activity and changes in business value is weak. The diagram uses a thin dotted line to depict this weak relationship.
However, the marketing strategy described in this post is based on the hypothesis that publishing a high-quality blog will increase brand awareness and buyer engagement. The relationships between blogging activity and both increased brand awareness and increased buyer engagement are direct and can be measured. So, if the hypothesis of the strategy is valid, improving the quality of blog content will result in greater brand awareness and buyer engagement.
The marketing strategy depicted in the diagram is also based on the hypothesis that increasing brand awareness and buyer engagement will result in more sales opportunities, which will result in more sales to new customers, which will lead to overall revenue growth. And revenue growth will create value for the enterprise.
The relationships among the adjacent marketing objectives shown in the above diagram can all be measured quantitatively, which enables the hypothesis of the strategy to be tested and validated.
The bottom line is, the chain of linked marketing activities and objectives in a marketing strategy map enables marketing leaders to test the effectiveness of their marketing strategy and to demonstrate the indirect impact of marketing activities on business outcomes and value.

Sunday, October 17, 2021

The Persistent Measurement Challenge: B2B Findings From "The CMO Survey"


This post will conclude my discussion of several B2B-specific findings from the August 2021 edition of The CMO Survey. In my earlier posts, I reviewed what the survey revealed about the state of marketing spending and the progress B2B companies have made on the digital transformation of marketing. You can find the two previous posts here and here.

The CMO Survey is a semi-annual survey of senior marketing leaders with for-profit U.S. companies. The survey is directed by Dr. Christine Moorman and sponsored by Duke University's Fuqua School of Business, the American Marketing Association and Deloitte LLP. A more detailed description of the survey is included in the first post in this series.

In this post, I'll focus on what The CMO Survey revealed about how B2B marketers are addressing the perennial challenge of measuring the impact and value of marketing.

Proving the Value of B2B Marketing

It's not news that marketers have been under pressure for the past several years to prove the business value of their activities and programs. The CMO Survey found that these pressures are increasing. Fifty-three percent of the survey respondents with B2B product companies said they are feeling increasing pressure from their CEO to prove the value of marketing. For survey respondents with B2B services companies, the comparable percentage was 68%.

The CMO Survey also addressed what metrics companies are using to measure marketing performance. It asked survey participants to distribute 100 points to reflect the degree to which their company is using seven marketing performance metrics. The following table shows how the respondents with B2B companies distributed the points.


The ultimate objective of most marketing leaders is to be able to measure the impact of marketing activities quantitatively, but this can be challenging, particularly when it comes to measuring the long-term impact of marketing. The CMO Survey asked survey participants which of the following three statements best describes how they demonstrate the short-term and long-term impact of marketing.

  • "We prove the impact quantitatively."
  • "We have a good qualitative sense of the impact, but not a quantitative impact."
  • "We haven't been able to show impact yet."
The following two charts depict how the respondents with B2B product companies and those with B2B services companies answered these questions.


These findings clearly show that measuring the business impact of marketing remains a significant challenge for B2B marketers. Fewer than half of the surveyed B2B marketers said they can measure the short-term impact of marketing quantitatively.
Even fewer B2B marketers can measure the long-term impact of marketing quantitatively - only 27.5% of marketers with B2B product companies, and only 36.4% of marketers with B2B services companies. More concerning, nearly a fifth of marketers with B2B product companies (18.8%), and 13.6% of marketers with B2B services companies cannot show the long-term impact of marketing at all.
Measuring the long-term impact of marketing is a difficult challenge for all marketers, not just B2B marketers. Only about a third of the B2C marketers who responded to The CMO Survey said they can show the long-term impact of their activities quantitatively.
Two years ago, Google published an excellent paper discussing "three grand challenges" relating to the measurement of marketing effectiveness. The authors of the paper acknowledged that perfect solutions for those challenges don't currently exist. In fact, the primary objective of the paper was to focus on the areas where existing methods of measuring marketing effectiveness are "running up against the boundaries of the possible."
I discussed the Google paper in three posts, which you can find here, here and here, and I encourage you to take the time to read the entire paper.


Top image courtesy of theilr via Flickr (CC).

Sunday, November 17, 2019

Two Ways to Improve Your ROI Credibility


With the fourth quarter of 2019 well underway, many marketing leaders will have already started planning for 2020. In most cases, the planning process will include an analysis of how well marketing performed in 2019. and many marketing leaders will use return on investment (ROI) as the primary tool for conducting this assessment.

Over the past two-plus decades, ROI has become the "gold standard" for measuring marketing performance and for communicating the performance and value of marketing to senior company leaders. So you would think that, by now, marketing leaders would thoroughly understand what marketing ROI is, and how to calculate it correctly. Unfortunately, however, that is not always the case, as a recent survey conducted by LinkedIn Marketing Solutions makes clear.

The LinkedIn Research

The Long and Short of ROI report is based on a survey of 4,000 B2B and B2C marketing professionals from 19 countries. Survey respondents worked in a wide range of industry sectors, including technology, financial services, professional services, and manufacturing. The survey was conducted in June 2019.

Most of the results presented in the survey report refer to "digital marketers." Unfortunately, the report does not define who "digital marketers" are, nor does it indicate whether all of the survey respondents were "digital marketers." With that caveat in mind, here are the "headline" findings from the LinkedIn study:

  • 70% of digital marketers claim they are currently measuring ROI.
  • 77% of digital marketers measure ROI during the first month of a campaign, even though 55% of those marketers reported having a sales cycle that is at least three months long.
  • When most digital marketers say they are measuring ROI, they are actually measuring a variety of key performance indicators (KPIs), but not true ROI.
  • 63% of digital marketers don't have a high level of confidence in the "ROI" metrics they are currently using.
The LinkedIn survey report argues that marketers should (a) clearly distinguish between KPI-based metrics and ROI, and (b) measure ROI over the length of the sales cycle in order to obtain accurate results.
When You Say ROI . . .Mean ROI
The findings of the LinkedIn survey highlight two of the still all-too-prevalent ways that many marketers are misusing ROI. First, many marketers use "ROI" as a catch-all term to describe a wide variety of benefits produced by marketing activities. But return on investment is a specific financial metric that has a well-established meaning among management and financial professionals.
This means that none of the following constitutes ROI:
  • Increased brand awareness
  • Increased market share
  • Increased customer lifetime value
  • Increased average deal size
  • Improved conversion rates
  • Improved response rates
  • Improved NPS/customer satisfaction scores
For many companies, tracking some or all of these performance measures will be valuable, but they do not constitute marketing ROI. Calling any of these benefits "ROI" reflects a misunderstanding of what ROI is, and if a marketing leader presents one of these kinds of ROI calculations to a CEO or CFO, his or her credibility will be weakened.
Calculate ROI Correctly
The second way that many marketers misuse ROI is to calculate it incorrectly. The basic formula for marketing ROI (MROI) is:

MROI = (Gain from Marketing Investment - Cost of Marketing Investment) / Cost of Marketing Investment

So the basic MROI formula contains only three components:
  1. The financial gain from the marketing investment
  2. The cost of the marketing investment
  3. Time - Although the formula doesn't expressly contain a "time" value, MROI is always measured for a defined period of time.
While the basic MROI formula appears to be quite simple, that simplicity is deceptive. In reality, calculating MROI accurately can become a complex task because every component of the formula presents questions that require thoughtful answers and sound judgment calls.
I've addressed many of these issues in several previous posts, so I won't repeat that material here. However, I've provided links to my ROI-related posts below. If you're involved in calculating MROI, I encourage you to take a look at these posts and carefully consider the issues they discuss.

Image courtesy of Rick B via Flickr CC.

ROI-Related Articles


Sunday, July 8, 2018

Where B2B Companies Stand With Marketing Measurement


Measuring marketing performance is both a top priority and a persistent challenge for most B2B marketers. That's the primary theme of Demand Gen Report's 2018 Marketing Measurement and Attribution Benchmark Survey. The 2018 survey produced responses from 283 marketing executives, most of whom were based in the United States. Respondents represented several industries and a wide range of company sizes (from less than $10 million to more than $1 billion in annual revenue).

Eighty-seven percent of the survey respondents said that marketing measurement is a growing priority for their company. However, more than half of the respondents (54%) said their ability to measure and analyze marketing performance "needs improvement" or is "poor/inadequate." Another 34% rated their measurement capabilities as just "average."

It also appears that progress on measurement capabilities has been slow since last year. The following table shows how respondents rated their measurement capabilities in the 2018 survey and in the 2017 edition of the study. As the table shows, the percentage of respondents rating their capabilities as excellent decreased from 13% to 7%, while the percentage rating their capabilities as poor/inadequate increased from 9% to 14%.


It's not hard to understand why measuring the financial performance of marketing continues to be a major challenge. In most companies, the two most important reasons to measure marketing performance are:

  1. To determine the economic value that marketing creates for the business; and
  2. To enable marketing leaders to optimize their mix of marketing programs and channels based on economic performance
Both of these objectives require the use of financial metrics, and this requirement has a big impact on measurement complexity. It's relatively easy to measure the performance of most digital marketing tactics and some offline tactics (e.g. direct mail) using non-financial metrics. But it's another matter to measure the financial performance of a marketing program.
The crux of the challenge is attribution, which is the process of assigning both revenues and costs to marketing activities. It's impossible to accurately measure the financial performance of a marketing program or channel unless you can accurately assign both economic benefits and costs to it. So the accuracy of your measurement system ultimately depends on the accuracy of your attribution method or model.
The Demand Gen Report survey provides strong evidence that attribution is a significant barrier to effective marketing performance measurement. Only about 30% of the survey respondents indicated they are doing any attribution analysis as part of their marketing measurement efforts. Among those using attribution, only about half (51%) said they are using some form of multi-touch attribution, while 14% said they use last touch attribution, and 12% said they use first touch attribution.
Research from other firms points to the same conclusion. In a 2017 survey by Econsultancy, in-house marketers were asked to identify the specific attribution methods they are using and rate the effectiveness of each method. The following table shows the percentage of respondents using each attribution method, and the percentage rating each method as very or somewhat effective.


These findings are troublesome because the three most widely used attribution methods (and four of the top five) are methods that attribute all of the revenue from a sale to only one marketing touch point. Even more troublesome, large majorities of the survey respondents rated these methods as very or somewhat effective, when the reality is that no "single touch" attribution method will produce an accurate picture of marketing performance.
Developing an accurate marketing attribution model is not simple or easy. The current "state of the art" is data-driven or algorithmic attribution modeling, but even these advanced solutions aren't perfect. The bottom line is that measuring the financial performance of marketing - particularly at the tactic, program, and channel level - is likely to remain challenging for the foreseeable future.
So how can B2B marketing leaders measure and demonstrate the value of marketing given the complex and imperfect nature of attribution? There are no silver-bullet solutions, but I'll offer a few suggestions in a future post. 

Top image courtesy of Pat Pilon via Flickr CC.

Sunday, February 19, 2017

How Small and Mid-Size Companies Will Practice Marketing in 2017


Target Marketing magazine recently published the findings of its annual "Media Usage Survey," which was designed to identify marketing spending plans for 2017. The survey was conducted in December 2016 and produced 725 responses from members of the audiences of Target Marketing and subscribers to Total Retail and NonProfit Pro magazines. The researchers suppressed participation by list services firms and creative services/advertising agencies so that all responses would be from marketers.

Forty-two percent of the respondents were affiliated with B2B companies, 36% with hybrid B2B/B2C companies, and 22% with B2C companies. Most of the survey respondents worked for small and mid-size companies:

  • 17% were with companies having $51 million or more in annual revenue
  • 22% were with companies having annual revenue of $5 million to $50 million
  • 50% were with companies having less than $5 million in annual revenue
Most of the respondents to the Target Marketing survey reported that their marketing budget for 2017 would the same or higher than in 2016. Thirty-seven percent said their 2017 budget would be higher, and 40% said their budget would stay the same compared to 2016. Only 15% of respondents said their marketing spending would be lower in 2017 than in 2016.

At larger companies, changes in marketing budgets showed greater variation. Fifty-one percent of respondents from companies with annual revenue of more than $50 million reported an increased marketing budget for 2017, while 20% of such respondents said they have a lower marketing budget this year.

Target Marketing also asked survey participants about the allocation of their marketing budget. The top four media categories identified by survey respondents were:
  1. Online marketing - on average, 36% of the total marketing budget
  2. Print (direct mail, magazines, newspapers, circulars, etc.) - 22%
  3. Live events - 19%
  4. Other - 13%
The report's authors noted that print experienced the biggest year-over-year change, falling from 29%  of the total marketing budget in the 2016 edition of the survey.

The survey also asked participants how their spending on specific marketing methods would change in 2017. The following table shows the top six marketing methods slated for spending increases this year:


Survey respondents reported that email marketing produces the best ROI for both customer acquisition and customer retention purposes. They also said that "Other" marketing methods produced the second strongest ROI for both acquisition and retention, and that direct mail produced the third-best ROI for both purposes.

The survey report did not indicate what marketing methods were included in the "Other" category. Given that these marketing methods command a significant percentage of the total marketing budget and produce strong ROI, it would be nice to know what specific methods the "Other" category encompasses.

Sunday, July 17, 2016

Activity Metrics Still Matter in Measuring Marketing Performance


Faced with growing demands by senior business leaders to demonstrate the value that marketing brings to the business, marketers have made measuring marketing performance one of their top priorities.

But despite all of the attention given to marketing performance measurement, recent research indicates that many marketers have more work to do to prove the value of marketing. In the Marketing Performance Management Study 2016 by VisionEdge Marketing and Demand Metric, only 23% of survey respondents said their CEO's would give marketing a grade of "A" on its ability to demonstrate its value and contribution to the business.

Many experts contend that the disconnect between marketing and the rest of the C-suite exists because marketers focus primarily on measuring marketing activities and the immediate results of those activities, and they don't put enough emphasis on measuring the impact of marketing on strategic business outcomes.

Some commentators have started calling activity measures "vanity metrics," so it's tempting to think that measuring activities and immediate results is no longer important.

It's clearly vital for marketers to measure the impact of marketing on strategic business outcomes and to communicate that impact to senior company leaders, but that doesn't mean that marketers should ignore activity metrics altogether. Measuring the impact that marketing has on strategic business outcomes is a critical aspect of managing marketing performance, but an effective performance management system for marketing must support several functions. For example, it should:

  • Measure the performance of individual marketing activities and programs so that marketers can make sound investment and marketing mix decisions
  • Enable marketers and other business leaders to evaluate how well their marketing strategy is working
  • Support both strategic and tactical decision-making
  • Enable marketing leaders to measure the effectiveness and efficiency of operational marketing activities and processes
In order to support all of these functions, a performance management system for marketing will necessarily include several types of metrics, including activity metrics. More specifically, an effective marketing performance management system will include:
  • Financial and non-financial measures
  • Metrics for leading and lagging performance indicators
  • Measures that focus on the strategic impact of marketing and metrics that support tactical decision-making
  • Measures of ultimate business outcomes and measures of activities, outputs, and intermediate outcomes
  • Revenue and cost metrics
When communicating with C-level executives, marketers should emphasize metrics that demonstrate the impact of marketing on strategic business outcomes, and it's usually a good idea to omit any detailed discussion of activity metrics. But activity and other operational metrics still play a vital role in managing the marketing function and improving marketing performance.

Think of it this way. For most of us, the primary reason for exercising regularly (our "strategic outcome") is to improve our health. We periodically monitor our health through physical exams and various tests, but many of us also track and record the results of our daily or weekly workouts, because they provide an indication of our health and physical condition. Our spouse or significant other is much more interested in the results of our latest annual physical than he or she is in how far we ran yesterday. But exercising regularly and monitoring our improvement are still important to a healthy lifestyle.

Sunday, July 13, 2014

For Better Marketing Decisions, Think Incrementally

Measuring marketing return on investment (MROI) has become increasingly popular, as marketers face growing pressures to demonstrate the value of their activities and programs. Marketers are calculating and using MROI for a variety of reasons, including:

  • To measure the effectiveness of individual marketing campaigns or programs
  • To demonstrate and prove the value that marketing contributes to the company
  • To justify and/or defend marketing budget levels
All of these reasons are valid, but the most important reason to use MROI is to improve the quality of marketing decisions. No single performance metric, including MROI, provides all of the information that marketers need for most significant decisions. However, because MROI is a ratio that compares economic returns with required investments, it has a unique ability to help marketers:
  • Determine whether a particular marketing program or mix of programs should be undertaken
  • Compare the projected and/or actual results of multiple and often dissimilar marketing activities or programs. This enables marketers to make sound choices when faced with alternative marketing investments.
Equally important, MROI can help marketers determine at what level a particular marketing program should be funded and executed. Unlike many investments, most marketing programs can be executed at any of several levels. For example, if your marketing database contains 10,000 contacts, you can run a direct mail campaign that is directed at all 10,000 contacts or at only a portion of the database. MROI enables you to analyze projected campaign performance at incremental levels.

To illustrate how this works, take a look at the example shown in the following table. This table contains the projected financial attributes of three alternatives for a prospective direct mail campaign. Option 1 would involve a mailing to 2,500 contacts, Option 2 would target 5,000 contacts, and Option 3 would target 10,000 contacts. For this example, we'll assume that the ROI Threshold (the minimum acceptable ROI for a marketing investment) is 25%.


Based on the projected results shown in the table, the company would not choose Option 1 because the estimated ROI is below the ROI Threshold. The projected ROI's for Option 2 and Option 3 exceed the ROI Threshold, so it might appear that either would be a reasonable choice. Even though Option 3 has a slightly lower projected ROI than Option 2 (26% vs, 28%), it would still exceed the ROI Threshold.

The real insight comes when you look at the lower portion of the above table, which shows the incremental financial performance differences between Option 1 and Option 2 and between Option 2 and Option 3.

Option 2 requires an additional investment of $30,000 (compared to Option 1), but it will produce a 41% ROI on that incremental investment. Option 3 requires an additional investment of $60,000 (compared to Option 2), but it will only produce a 23% ROI on that incremental investment. Since the incremental ROI generated by Option 3 is below the ROI Threshold, the company should typically choose Option 2 over Option 3.

In reality, the optimum "size" of this direct mail campaign falls between Option 2 and Option 3 (in other words, somewhere between 5,000 and 10,000 contacts). With additional data, that optimum size can easily be determined.

Because marketing programs can be executed at different levels, measuring MROI on an incremental basis can be a powerful tool for improving marketing decision-making and performance.

Sunday, June 1, 2014

Increased Profits, Not Higher Revenues, Determine Marketing ROI

Measuring return on marketing investment (MROI) has been a major point of emphasis in many companies for the past several years. So by now, you would think that the process for calculating MROI is well understood. Unfortunately, I still see far too many examples of MROI that has been calculated incorrectly - in many cases, by people who should know better.

One of the most common and serious mistakes is the use of increased revenues (sales) rather than increased profits when calculating MROI. To illustrate this error, take a look at the following table. I based this table on an example ROI calculation that appeared on the website of a well-known national provider of direct mail services. I won't name the company because they are only one of many companies that use this methodology.


In this example, Return on Investment (ROI) was calculated by dividing Total revenue ($1,250) by Total cost of the mailing ($550), resulting in an ROI for the mailing of 227%

That ROI number looks fantastic, but the problem is, it's flat out wrong. Way wrong.

The basic formula for calculating ROI is:

ROI = (Gain from Investment - Cost of Investment) / Cost of Investment

For ROI purposes, Gain from Investment is the incremental gross profit (gross revenues less cost of goods sold) produced by a marketing investment, as illustrated by the following "waterfall" diagram.


Using incremental sales or revenues in the marketing ROI calculation distorts ROI because most marketing campaigns or programs are designed to increase sales volume. And increases in sales volume are not free - there are always costs associated with producing and delivering the additional products or services. (Note:  If a company has extremely high gross profit margins, using revenues to calculate MROI can be relatively accurate. For example, computer software companies can have high gross profit margins because the cost of producing an additional copy of the program is negligible. However, this situation is the exception, not the rule.)

The first problem with the methodology used in the direct mail example is that it bases ROI on revenues rather than gross profits. If the cost of goods sold of the products covered by the example is 50% of the selling price, the incremental gross profit produced by the direct mail program would be $625 (total revenue of $1,250 X 50%). Using incremental gross profit causes the ROI to drop from 227% to just under 114% ($625 / $550). That's a more accurate ROI calculation than the one used in the original example, and it's still an impressive number, but it's also still wrong

To calculate MROI correctly, you must subtract the cost of the marketing investment from the gross profit produced by that investment and then divide by the cost of the investment.

So, the real ROI produced by the direct mail program would be calculated as follows:

ROI = (Gross Profit - Total Cost of the Mailing) / Total Cost of the Mailing
ROI = ($625 - $550) / $550
ROI = 14%

It should be clear that inaccurate calculations of MROI can lead to unprofitable marketing decisions. Equally important, they can also undermine marketers' credibility with senior company leaders. Would you want to tell your CEO and CFO that a marketing campaign has an ROI of 227% when the real ROI is 14%?

The moral of the story is:  If you're going to calculate MROI, be sure to calculate it correctly.

Sunday, November 17, 2013

How to Know if Your Marketing Strategy is Working

The foundation of all effective marketing efforts is a sound marketing strategy. Most marketing leaders feel fairly comfortable formulating strategy, but many find it difficult to measure how well their marketing strategy is actually working. The solution for this perennial challenge is a marketing Balanced Scorecard.

When Robert Kaplan and David Norton introduced the Balanced Scorecard in the early 1990's, they saw it as simply a better way to measure organizational performance. However, many early adopters started using the Balanced Scorecard as a tool for implementing business strategy. They recognized that if the objectives and measures included in their Balanced Scorecard were derived from their strategy, the scorecard would become an effective tool for describing the strategy in
measurable terms. Therefore, the Balanced Scorecard quickly evolved from a pure performance measurement system to a tool for managing strategy.

This is my third post about using a Balanced Scorecard to measure and manage marketing performance. In my last post, I described the four "perspectives" used in a Balanced Scorecard. In this post, I'll describe how a Balanced Scorecard can help you determine how well your marketing strategy is working.

The key to using a Balanced Scorecard to manage marketing strategy is something called a strategy map. A strategy map is essentially a set of linked strategic objectives that are organized using the four Balanced Scorecard perspectives. The diagram below depicts a high-level, generic version of a Balanced Scorecard strategy map for marketing.


Each of the rectangles in a Balanced Scorecard strategy map will contain objectives that are derived from your company's marketing strategy. In the above diagram, the rectangles contain descriptions of the kinds of objectives that would be included. For example, in the internal process perspective, one set of objectives will relate to the campaigns or programs that marketers design and execute.

In a Balanced Scorecard strategy map, the lines connecting the rectangles represent the cause-and-effect relationships that exist among your company's strategic marketing objectives. These causal relationships define the "logic" of your marketing strategy, and they tie the objectives together to create a cohesive strategy. Describing these cause-and-effect relationships is one of the most critical steps in building a sound marketing strategy, and using a strategy map forces you to make these relationships explicit and visible.

In a Balanced Scorecard strategy map, the cause-and-effect lines indicate that achieving one objective is what enables another objective to be achieved. For example, the above diagram is indicating that if a company successfully achieves its customer value proposition objectives, the company will achieve its objectives relating to customer acquisition and customer loyalty. And, if the company achieves its customer acquisition and customer loyalty objectives, it will be able to reach is revenue growth objectives.

The most powerful argument for using a Balanced Scorecard to measure and manage marketing performance is that it provides a mechanism for demonstrating and documenting how individual marketing activities fit into and support your marketing strategy, and for connecting individual marketing activities and programs to ultimate business outcomes. The objectives and measures used in the customer, internal process, and learning and growth perspectives are leading indicators of the business outcomes that define marketing success. So, by monitoring your progress toward achieving all of the objectives included in your strategy map, and by testing the validity of the cause-and effect relationships you've defined in your strategy map, you are also measuring the effectiveness of your marketing strategy.